

Optimizing User Experience: The Science of A/B Testing Analytics
Are you struggling to optimize your website and improve user experience? You’re not alone. A/B testing could be the solution for you, providing real-world data on how users interact with different versions of your site.
This article will dive into the world of A/B Testing, exploring its relevance, workings, and analytics behind it all while debunking common mistakes so that you can make well-informed decisions.
Ready to unlock insights like never before?.
Key Takeaways
- A/B testing is a process that compares two versions of a webpage or marketing campaign to determine which one performs better in terms of user engagement and conversion rates.
- The analytics behind A/B testing involve understanding statistical significance, discrete and continuous metrics, and different testing methods such as Fisher’s exact test, Pearson’s chi-squared test, and Z-test.
- By utilizing A/B testing techniques, businesses can make data – driven decisions to improve their web marketing strategies, optimize user experiences, and achieve higher conversion rates.
Understanding A/B Testing
A/B testing is the process of comparing two versions of a webpage or marketing campaign to determine which one performs better in terms of user engagement and conversion rates.
What is A/B testing?
A/B testing is a controlled experiment that optimizes web marketing strategies by assessing two different designs, known as A and B. In the digital world, these designs could range from website layouts to email campaign formats.
This comparative analysis helps identify which variant performs better in achieving set goals such as increased click-through rates or conversion rates. It’s about measuring the efficacy of websites using discrete (binomial) metrics like click-through rate, bounce rate, conversion rate and continuous (non-binomial) metrics such as average revenue per user or session duration.
The deciding factor is statistical significance – an indicator of whether the difference between A and B results just happened by chance or if one design genuinely outperforms the other.
The Importance of A/B Testing
A/B Testing plays an essential role in optimizing web marketing strategies. It allows digital marketers to make data-driven decisions, rather than relying on guesswork. In this process, two versions of a webpage are presented to users at random, and statistical analysis is used to determine which version performs better for a given conversion goal.
A significant benefit of A/B testing is that it can lead to improved user experiences and higher conversion rates. However, correctly interpreting the results demands understanding statistical significance – ensuring that observed differences aren’t merely due to chance but reflect authentic improvements.
Notably, A/B testing isn’t suitable for evaluating major changes like new products or entirely different user experiences; but when applied wisely, it is a powerful tool in the arsenal of digital marketers and UX designers alike.
The Analytics Behind A/B Testing

The analytics behind A/B testing involve understanding statistical significance, discrete and continuous metrics, and different testing methods such as Fisher’s exact test, Pearson’s chi-squared test, and Z-test.
Statistical significance
Statistical significance plays a pivotal role in A/B testing. It effectively determines the probability that the observed difference between two variables, say design A and B, occurred due to pure chance.
Analysts use it to establish whether the data collected presents substantial evidence to conclude that an effect exists, ensuring reliable decision making for businesses. The p-value is a crucial component in this process.
This statistical tool represents how likely we are to observe a result as extreme as our sample statistic if the null hypothesis holds true. In most cases, A/B testers prefer two-tailed tests because they don’t make assumptions about the direction of the discrepancy between variations, making them more accurate and trustworthy for analysis stakes.
Discrete metrics
Discrete metrics, or binomial metrics, play a crucial role in A/B testing. They consist of binary values, either 0 or 1. These key analytics results are often captured through click-through rate, conversion rate and bounce rate.
For instance, the click-through rate involves whether a user clicks on a particular element of a page or not while the conversion pertains to whether the user performed a desired action such as subscription or purchase.
The analysis of these discrete metrics begins with statistical methods like Fisher’s exact test for smaller sample sizes and Pearson’s Chi-Squared Test for larger groups offering an approximate p-value in each scenario.
Continuous metrics
Continuous metrics, also known as non-binomial metrics, play a crucial role in A/B testing. These metrics provide insights into user behavior and help optimize conversions. Examples of continuous metrics include average revenue per user, average session duration, and average order value.
By continuously monitoring these metrics, businesses can identify early trends and make necessary adjustments in their A/B testing strategies. It is important to consider conversion rates, click-through rates, bounce rates, and other engagement metrics as continuous metrics when analyzing the effectiveness of web marketing strategies.
Continuous non-normal metrics
Continuous non-normal metrics, such as average revenue per user, average session duration, and average order value, are important factors to consider in A/B testing. These metrics do not follow a normal distribution and require different statistical methods for analysis.
By measuring these continuous non-normal metrics, we can gain deeper insights into the effectiveness of our websites and make data-driven decisions to optimize performance. A/B testing allows us to compare variations of a web page or marketing campaign using these metrics, helping us understand which version yields better results.
Different Testing Methods in A/B Testing

There are various statistical testing methods used in A/B testing, such as Fisher’s exact test, Pearson’s chi-squared test, Z-test, Student’s t-test, Welch’s t-test, and Mann-Whitney U test.
Discover which method is best suited for your experiments by reading more.
Fisher’s exact test
Fisher’s exact test is a statistical method commonly used in A/B testing to compare proportions or percentages between two groups. It is particularly useful when dealing with small sample sizes or rare events.
This test calculates an exact p-value by analyzing a contingency table, making it suitable for discrete metrics like click-through rate. When the assumptions for other tests are not met or the sample size is small, Fisher’s exact test provides an accurate alternative for determining statistical significance.
Its ability to handle these situations makes it a valuable tool in analyzing A/B testing results.
Pearson’s chi-squared test
Pearson’s chi-squared test is a statistical method commonly used in A/B testing to analyze categorical data and compare the distribution of outcomes between different groups. It helps determine if there is a significant difference between observed and expected frequencies in a contingency table.
The test calculates a chi-squared statistic to measure the discrepancy between these observed and expected frequencies. Additionally, it provides an approximate p-value for statistical significance, allowing researchers to make informed decisions based on the data.
In A/B testing, two-tailed tests are typically preferred since they consider all possible differences between design variations without assuming any specific direction of discrepancy.
Z-test
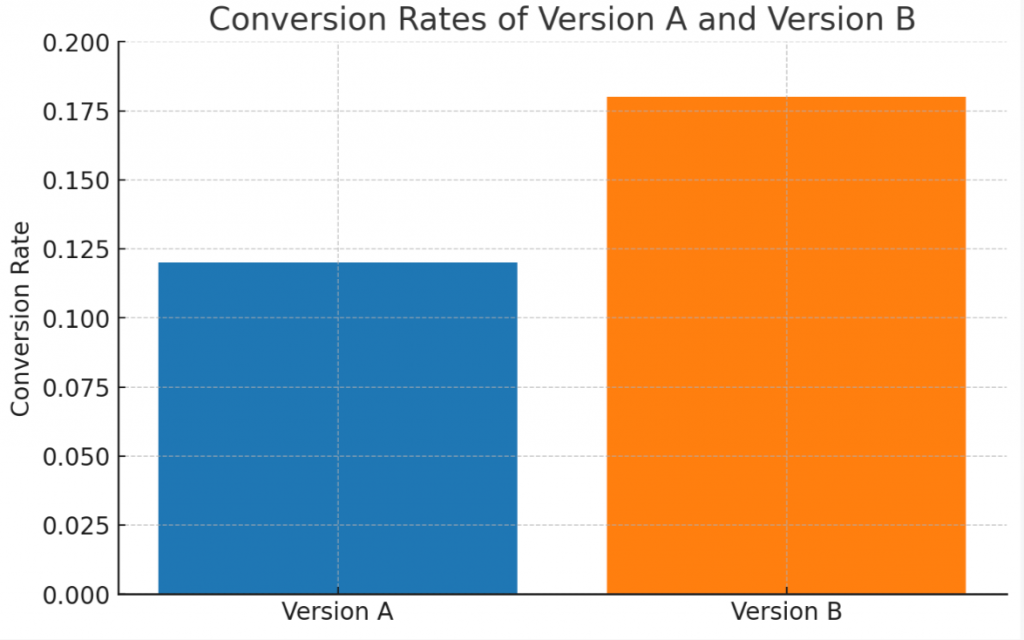
The Z-test is a commonly used statistical method in A/B testing to determine if there is a significant difference between the conversion rates of the control and test versions. It calculates a Z-score, which measures how many standard deviations a data point is from the mean.
This Z-score is then compared to a critical value to determine if the results are statistically significant. The choice of testing method, including the Z-test, depends on factors such as data type, sample size, and assumptions about data distribution.
Student’s t-test
The Student’s t-test is a statistical test that plays a crucial role in A/B testing. It helps us determine if there is a significant difference between the control and test versions of an experiment.
This test is especially useful when comparing the means or averages of two groups in A/B testing. By analyzing the data using the t-test, we can gather insights about whether our changes have had a meaningful impact on the metrics we are measuring.
Welch’s t-test
Welch’s t-test is a statistical test used in A/B testing to determine the significance of observed differences between designs A and B. It is specifically employed when the variances of the sampling distributions are not similar.
This method allows for accurate comparisons of means between two groups even when the assumption of equal variances is violated. Welch’s t-test is particularly useful when conducting A/B testing for continuous metrics with unknown variance ratios.
By analyzing the results using this robust statistical test, businesses can make data-driven decisions and optimize their strategies based on conclusive evidence.
Mann–Whitney U test
The Mann-Whitney U test is a statistical method commonly used in A/B testing to compare two independent groups and determine if there is a significant difference between their distributions.
Unlike other tests, the Mann-Whitney U test does not assume a specific distribution for the data. This makes it particularly useful for continuous non-normal metrics when assumptions of normality cannot be satisfied.
By using this test, analysts can confidently evaluate the effectiveness of different variations and make data-driven decisions to improve web marketing strategies.
Practical Application of A/B Testing

A/B testing can be applied in various practical scenarios, such as analyzing marketing campaigns and utilizing Google Analytics experiments to improve website performance.
Marketing Campaign Analysis
Marketing campaign analysis is a crucial step in A/B testing to evaluate the effectiveness of different strategies. By analyzing the data collected during an A/B test, marketers can determine which version of a marketing campaign performs better in terms of metrics such as click-through rate, conversion rate, and bounce rate.
This analysis helps identify areas for improvement and guides future decision-making in order to optimize web marketing strategies and achieve desired outcomes. With the use of statistical tools and methods, marketers can confidently make data-driven decisions that lead to more successful marketing campaigns.
Google Analytics Experiments
Google Analytics Experiments is a tool that allows users to create and run A/B tests on their websites or apps. With this tool, you can test different variations of your webpage or app to see which one performs better.
It helps you understand how changes in design, content, or user experience affect user behavior and conversions. Some key features of Google Analytics Experiments include the ability to set up multiple page variations, track conversion events, and split traffic between the control and test groups. By using Google Analytics Experiments, you can make data-driven decisions and optimize your website or app for better performance.
Common Mistakes in Conducting A/B Testing
Conducting A/B Testing involves several potential pitfalls that can undermine its effectiveness and accuracy.
Invalid Hypothesis
Having an invalid hypothesis can lead to inaccurate conclusions in A/B testing. This common mistake can undermine the interpretation of test results and hinder the validation and replication of findings.
It is crucial to have a solid hypothesis when conducting A/B tests to ensure focused and meaningful experiments. Prematurely ending tests based on an invalid hypothesis is another pitfall to avoid.
By formulating valid hypotheses, marketers and analysts can make more informed decisions based on reliable data and improve their web marketing strategies.
Testing too many components at once
Testing too many components at once is a common mistake in A/B testing. This occurs when multiple variables or elements of a website are changed simultaneously, making it difficult to determine which specific change led to the observed results.
By testing too many components at once, it becomes challenging to isolate and attribute the impact of each individual change on user behavior or performance metrics. To obtain accurate insights from A/B testing, it is crucial to test one component at a time, allowing for clear and definitive conclusions about its impact.
Ignoring Statistical Significance
Ignoring statistical significance in A/B testing can have serious consequences. Statistical significance is crucial in determining the reliability of test results and whether any observed differences between designs are due to chance or not.
By ignoring this important factor, we run the risk of making inaccurate conclusions and basing our decisions on faulty data. It’s important to carefully analyze the statistical significance of our findings before drawing any conclusions from an A/B test.
This ensures that our decision-making is informed by reliable data and increases the likelihood of achieving meaningful results.
Not taking external factors into account
Not considering external factors is a common mistake in conducting A/B testing. A/B testing requires careful consideration of these external factors to ensure accurate results. Ignoring external factors can lead to inaccurate conclusions about the effectiveness of different designs.
For example, changes in user behavior or concurrent marketing efforts can significantly impact the outcome of an A/B test. To capture interactions with these external factors and obtain more comprehensive results, multivariate testing is recommended.
By taking into account all relevant variables, businesses can make better-informed decisions based on their A/B testing outcomes while avoiding misleading interpretations.
Conclusion

In conclusion, A/B testing is a powerful tool for optimizing web marketing strategies. By analyzing the analytics results and using statistical methods, businesses can make data-driven decisions to improve user experience and performance.
Incorporating A/B testing into their digital marketing efforts enables companies to continuously experiment and refine their approaches for better results.